

Markov Chains Primer
Let’s start with a concept that is much more familiar to any B2B marketer: the concept of a buyer’s journey. As our prospect starts researching a topic of interest (which our marketing content across multiple channels covers – at least we hope so), they go through a series of interactions with our brand. Most marketers track this journey (which of course depends on their ability to collect and connect touchpoints from across multiple systems and databases) by following the order of interactions prospects have had with their brand.
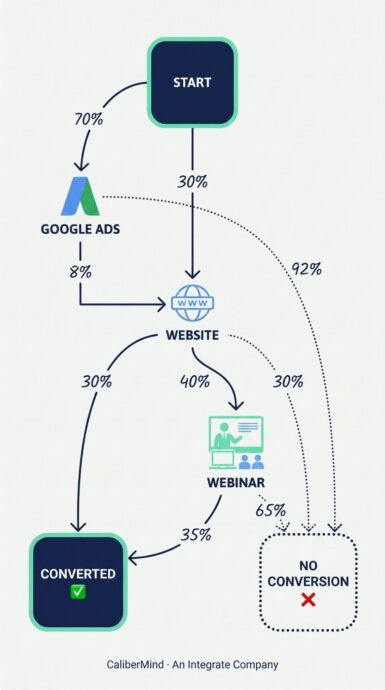
What most of us are interested in along this path is the conversion rate from one type of interaction tactic (say, Google ad clicks or webinar attendances) to the next. If we aggregate the data for each interaction path, we will create what is called a transition matrix that shows the transition probability for each touchpoint.
If you look at the diagram to the right, you will see that we can calculate transition probabilities for each conversion path for those who start their journey and find us via Google Ads, and those who first find us through our website.
Knowing the volume of traffic, we can estimate the number of conversions for a given number of prospects by following the chain of probabilities through all possible paths to conversion. This is not far from the concept of a marketing funnel or a waterfall.
If we use simple numbers, we can illustrate what conversion estimation would look like for 100 prospects:
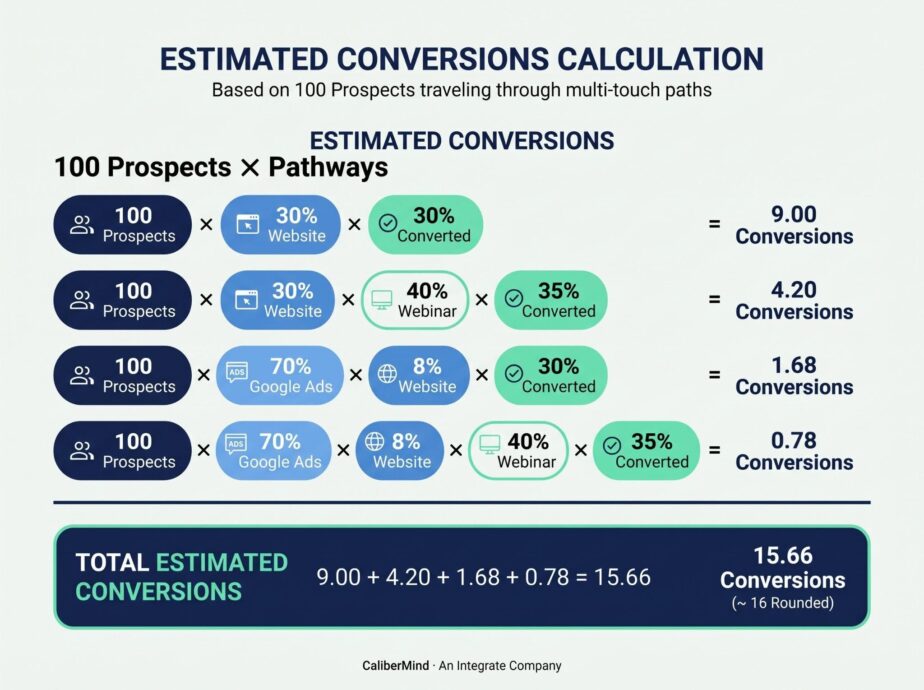
Caveat: This might not look too bad in terms of the calculations and the data points needed to arrive at a final conversion number. But what if we have 10 marketing channels that these 100 prospects might engage with? That’s 1010100=10,000 potential journeys. Now we are talking about a lot of data. In B2B, we simply may not have enough data to run this model.
Data volume aside, though, the above calculation illustrates the first part of how a Markov chain works. Operating within the world of probability, it calculates the contribution of each path to our overall conversion rate first.
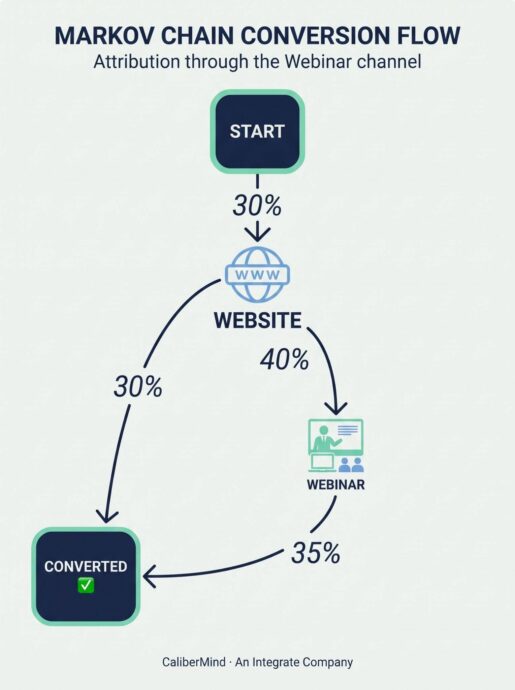 Next, it needs to understand what each touchpoint (or tactic) contributed along the way. How much did the webinar drive the probability that the journey goes on? How much does a Google ad influence the continuation of the journey? To do that, Markov chain models use what is known as the “removal effect,” where the touchpoint of interest is removed from the model and the probabilities of conversions are recalculated.
The delta (the difference) between the new conversion probability at each remaining touchpoint against the previous conversion probability before removal is deemed as the value or weight of that touchpoint.
For example, we can remove Google Ads from our journey, pretending that our webinars represent the starting touchpoint for most of our prospects. This could be true for industries that require professionals to obtain continuing education credits. If our webinars do that, this discovery path for our brand might make sense.
This hypothetical removal yields an overall conversion rate of 0.132 (13.2%):
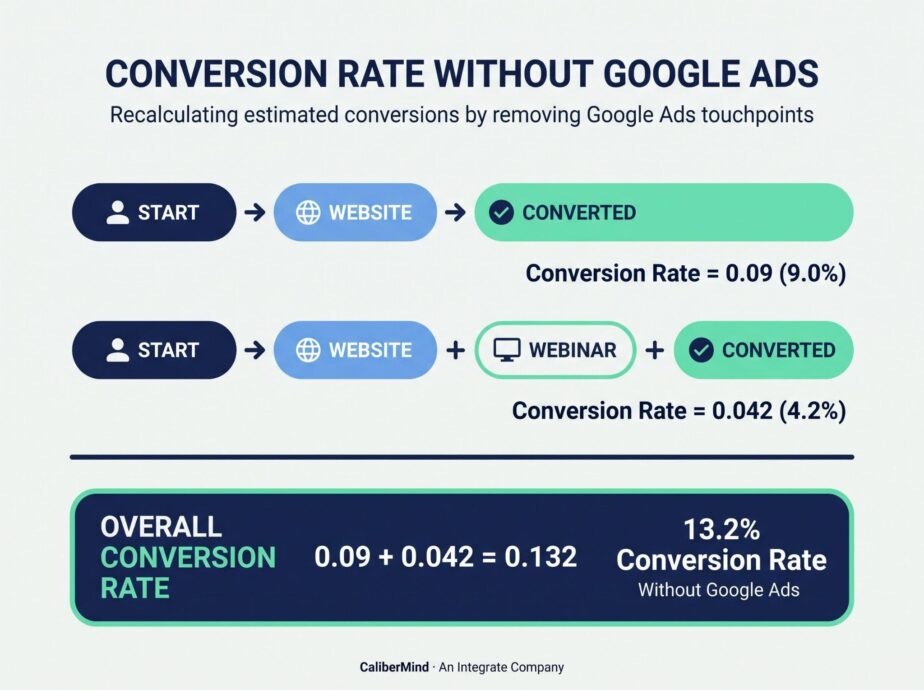
If our conversion rate without Google Ads is 13.2%, that means Google Ads was contributing roughly 2.46% (0.0246) to our previous overall ~15.66% conversion rate.
That is 0.0246 / 0.1566 = 15.7% of overall conversions.
This 15.7% value is known as the Removal Effect of the Google Ads touchpoint and is a key number in calculating each touchpoint’s (or tactic’s) overall attribution weight.
This is the basic, simplified functionality of a Markov chain model.
Three Underlying Assumptions of Markov Chain-Based Models
All Markov chain–based models assume that the following things are true:
 Removing particular touchpoints doesn’t push more customers to other channels. This assumes that if you stopped advertising on Google Ads, those who would have found you via that channel would not now find you more often through webinars instead.
Is this true for your org? That’s a good question to ask.
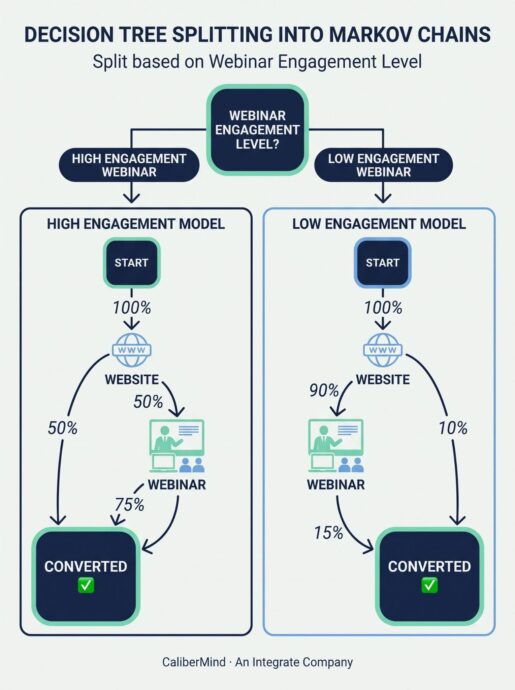
- Conversion probability is assumed to be constant. This assumption may not always hold true. Let’s take webinars: depending on the speaker and the topic of each webinar, their probability of transition to the next point in the journey would differ greatly. An analytics person would argue that now we need to build a regression tree model around our Markov model that would break out webinars into more engaging and less engaging, which would alter the conversion paths altogether—even if more prospects take that path!
- The condition of the model’s “memorylessness.”
This means that the model doesn’t care about the previous touchpoints along the path as contributing factors to what happens next at any given point in time. The only thing that matters for the model, once it figures out all of these probability percentages, is the immediately preceding touchpoint (or previous state). Because the model only looks back once—to the previous state—this type of Markov chain model is called a first-order Markov chain.
And this is where I was challenged on the utility of such models in B2B marketing.
The argument went like this: A customer’s propensity to convert at each stage is surely affected by more than just the single previous touchpoint in the customer journey. Therefore, the challenger stated, this memoryless property of the first-order model presents a problem—it is neither accurate nor representative of reality.
And now, we enter the domain of higher-order Markov models.
First vs. Second-Order Markov Models: Benefits and Drawbacks
 Remember that memoryless property of first-order Markov chains?
Well, the second-order model expands the model’s memory and allows it to look back two states,considering individual touchpoints in pairs.
The 1st-order path ABCD becomes a 2nd-order path of ABBCCD. It’s almost like adding interaction terms in statistical regression models, because now we are dealing with transition probabilities of each higher-order path being a product of the transition probabilities along the lower-order path it was built from.
All other model steps – such as calculating the removal effect and weights – apply as well, only here the math becomes a bit harder.
If you continue with this logic and give your model more memory, allowing it to look back three states (or maybe even four), you arrive at higher-order Markov chains with expanded dependencies on what happened two, three, or four touchpoints prior.
In reality, most people will probably never see Markov models with orders higher than 3, because there is a high chance such a model would run into diminishing returns and a drop in accuracy.
But what about first vs. second-order models? Is it true that 1st-order Markov models used for multi-touch attribution are inaccurate because we need a longer “memory” of our touchpoints?
Picking the Best Model through the Art of Analytics
This is where the art of analytics comes in. Dr. Joel Sokol, Director of the Master of Science in Analytics program at Georgia Institute of Technology, places high emphasis on the application of good business common sense in choosing the right model that can operate within business constraints, and interpreting the results in the right business context.
If we apply this rule of thumb to first vs. second-order Markov models, we have to be cognizant of three major factors:
1. Data Volume Needed
If in the first-order Markov model case we needed 10,000 data points for a cohort of 100 customers (or, rather, that’s the space the model was trying to cover) traveling through 10 marketing channels, the second-order model expands this requirement to 100,000 paths (now, it’s 10 channels to the second power). That’s a lot of data. While this is highly possible for a large e-commerce business with high web traffic, a B2B organization that has 500 opportunities opened within the span of 12 months with an average deal cycle of 4–6 months may not have nearly enough data to model a second-order chain.
Even if a creative marketer utilized conversion proxies (as I tried once), replacing “Closed Won” as the conversion outcome with “Stage = MQA” to try to understand what combination of path tactics would yield the most MQAs created, the amount of data would still be extremely insufficient for a higher-order Markov model.
2. All Touchpoints of the Same Type Being Equal (Ceteris Paribus)
In statistics, we use the ceteris paribus principle when we model data with multiple variables, which means that if we try to interpret a change driven by one variable, all other variables have to remain equal to the previous version of the experiment. Only one thing can change with each new experiment for the outcome interpretation to be meaningful.
So, if you expand your model memory to two previous touchpoints and include this interaction, you want to make sure the efficacy of those previous touchpoints is consistent at all times. In reality, it is not. The variability across the same type of tactic—such as a webinar or an ad—swings widely. How effective a webinar is depends on the speaker, the topic, the platform, the promotion given to the webinar, etc. How effective each ad is depends on the copy, the color, the size, etc. But your model doesn’t know it. To the model, a webinar is a webinar is a webinar – all being of the same effectiveness. A yellow background ad is the same as a green background ad. It’s all just an ad. But these things are never the same!
And then, the business changes course every 9–12 months, rendering all previous frameworks obsolete. A new CMO brings a new marketing mix. New tech tools change the cadence of touchpoints created.
And just like that, we arrive at a violation of “all other things being equal.” There is no ceteris paribus in B2B marketing for most companies, so expanding the model memory to look back much further—even if we had the data—stops being of value since there are layers of variability within each tactic that a model treats as a constant. The expanded memory is now working against us!
3. Explainability
The more complex a model is, the more difficult it is to explain its results to business stakeholders and secure buy-in and alignment. The simplest model, within its limitations, is often the best model. Which begs the question: how many orders deep do you want to go for your CFO, or even CMO, to understand what you are trying to explain?
Conclusion
 There is no such thing in analytics as an inherently good or bad model. A first-touch model is no better or worse than a last-touch or even-weighted model when used in the right context and for the right purpose—and a first-order Markov model is no different when compared to a second-order model.
The right way to evaluate any data model – attribution or otherwise – is never by its academic purity but rather by the real-world constraints under which it must operate: data availability, collection costs, and the speed of change in your business environment. As Dr. Sokol reminds his GA Tech analytics students every chance he gets, the art of analytics lies in our ability to extract actionable, directional decision-making from our data—not in chasing the label of “best.”
And from my own experience, I can attest that the goal of B2B marketing analytics that deals with thin, voluminous and murky marketing data is the opposite of mathematical perfection.
Contingent on how much data you can realistically capture, how fast your marketing mix evolves, and whether your output leads to smarter directional decisions, the goal of marketing analytics modeling is driving the business forward with models your stakeholders actually understand and can be aligned around.
And this is the true art of analytics.